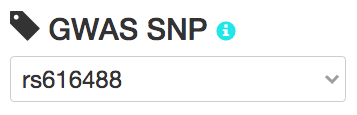
Detailed steps:
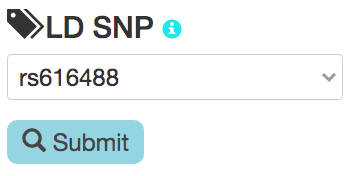
- Select or enter a GWAS SNP rsID.
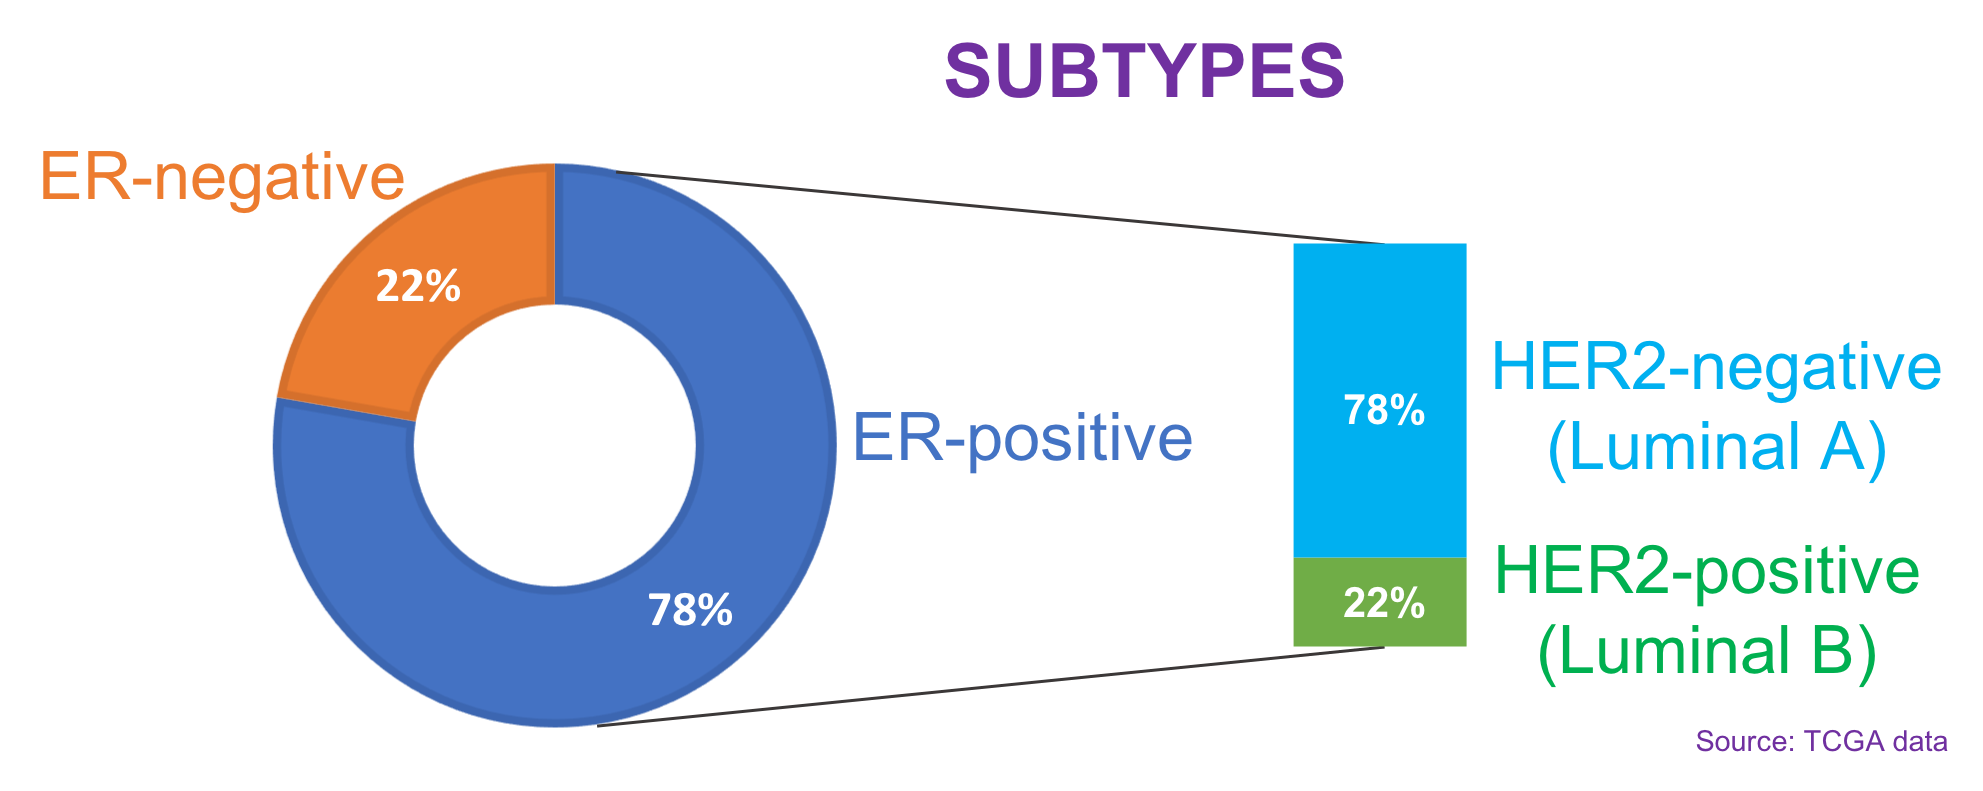
- We have manually curated a list of GWAS SNPs which were implicated in estrogen
receptor-positve breast cancers. We have collected a total of 130 GWAS SNPs.
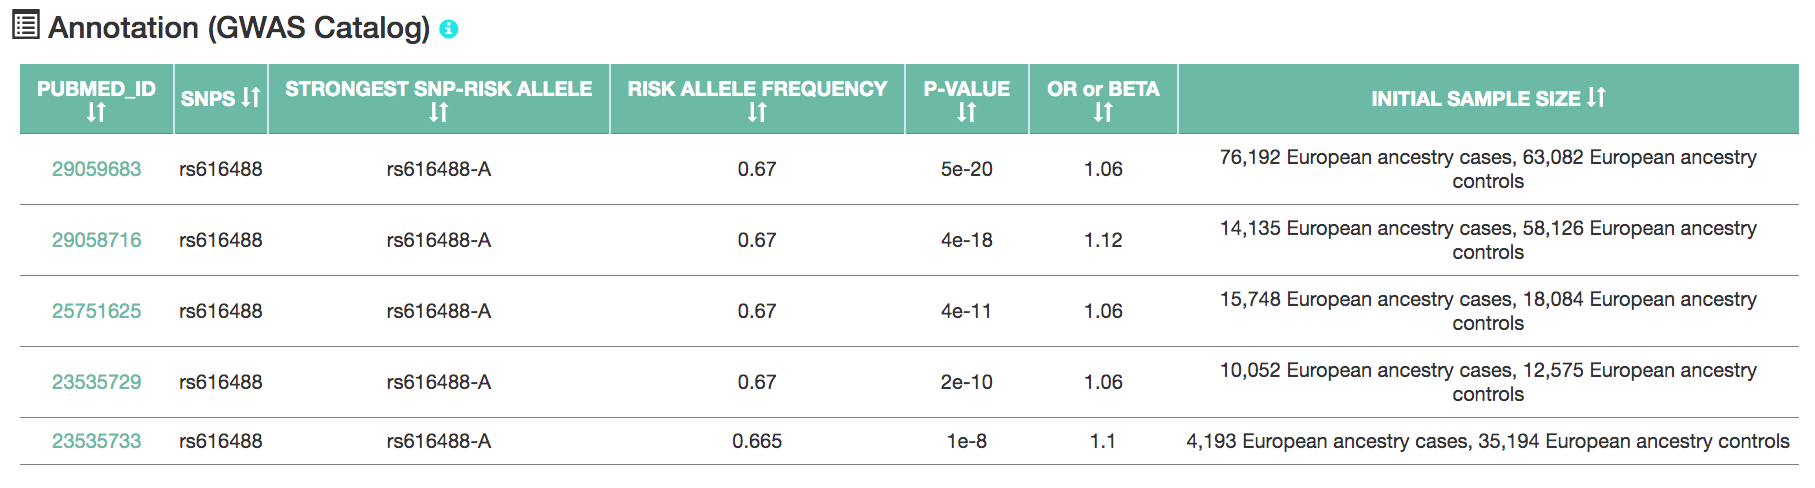
- A GWAS annotation table on the right updates based on the selected GWAS SNP.
- Select or enter a high linkage disequilibrium (LD) SNP rsID and click the submit button.
- For the selected GWAS SNP, select one of the SNPs in high LD (r2 >= 0.8)
with the GWAS SNP. The LD calculations are based on the 1000 Genomes Phase 3 data.
- By clicking the submit button, the various modules organized as tabs below the submit
button load to reveal detailed analyis on the selected GWAS and LD SNPs.
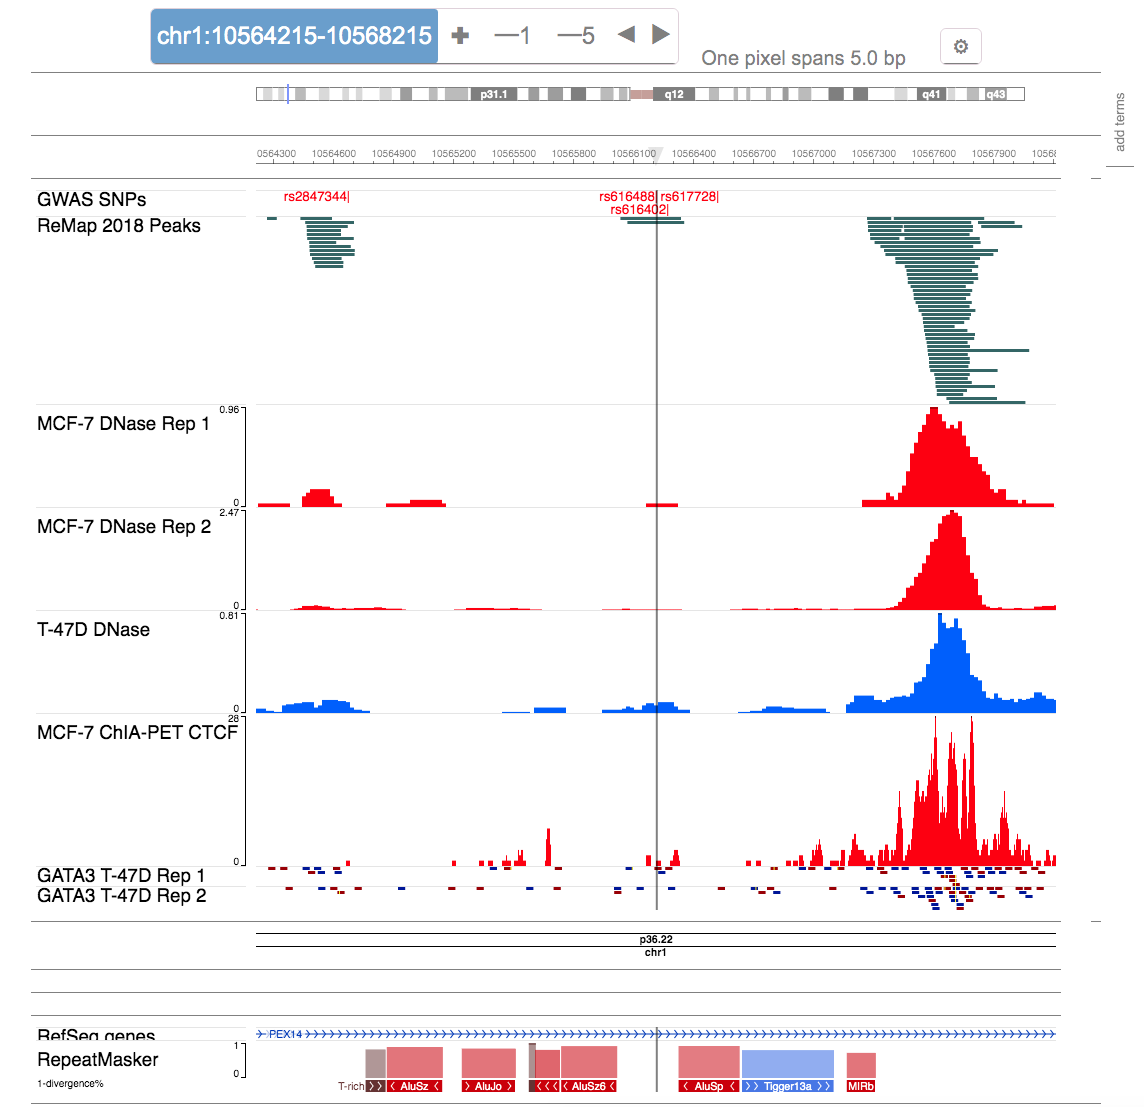
- Tab 1: Genome browser
- For the selected LD SNP, the genome browser shows various tracks at the SNPs locus.
- If the LD SNP is a high confidence locus based on computation analysis, more information related to the downstream mechanisms is displayed in the same panel to get a complete picture of the locus.
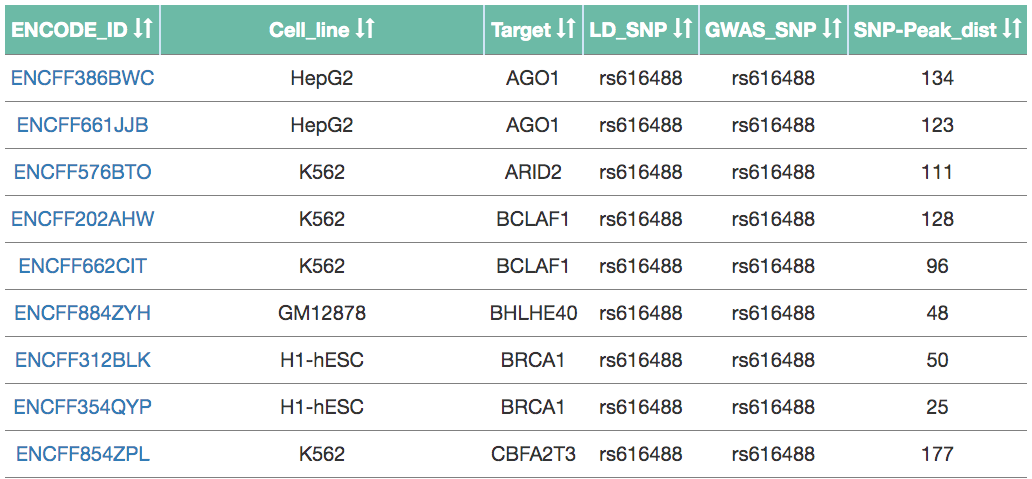
- Tab 2: ENCODE
- For the selected LD SNP, this tab shows all the ChIP-seq datasets from ENCODE which contain at least one peak containing the LD SNP.
- The table can be filtered based on breast tissue or breast cancer related cell lines alone.
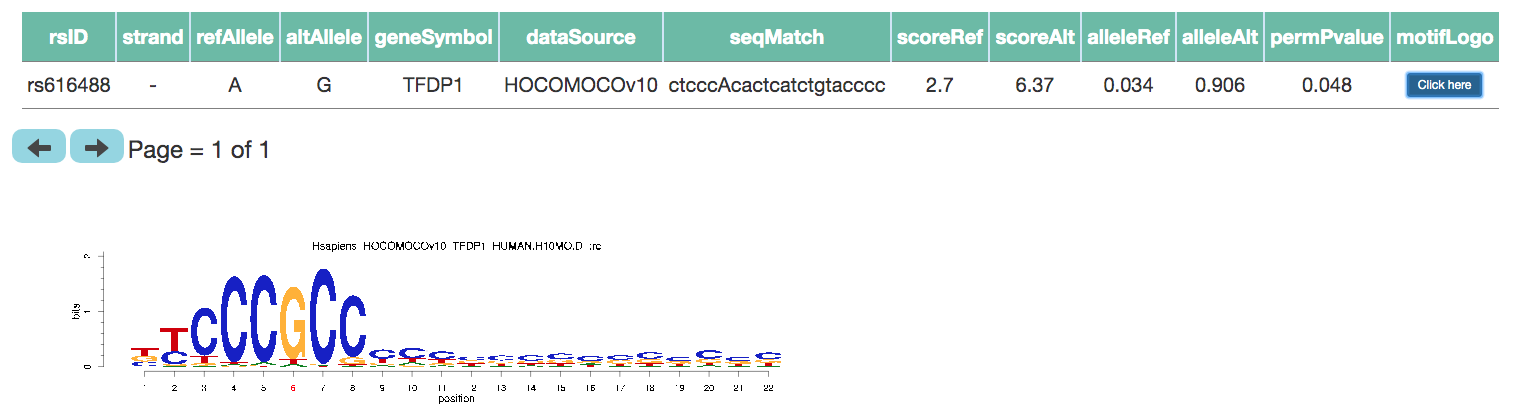
- Tab 3: Motif disruption
- For the selected LD SNP, motif analysis as described in the paper is performed to show all the potential motifs disrupted by the LD SNP.
- For each potential disruption, p-value and other information is tabulated along with an option to display motif logo highlighting the position of the SNP.