Detailed steps:
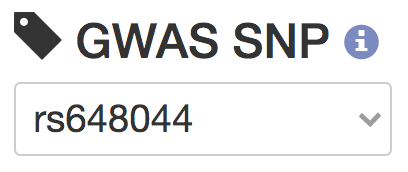
- Select or enter a GWAS SNP rsID.
- We gathered a total of 21 low-grade glioma GWAS SNPs.
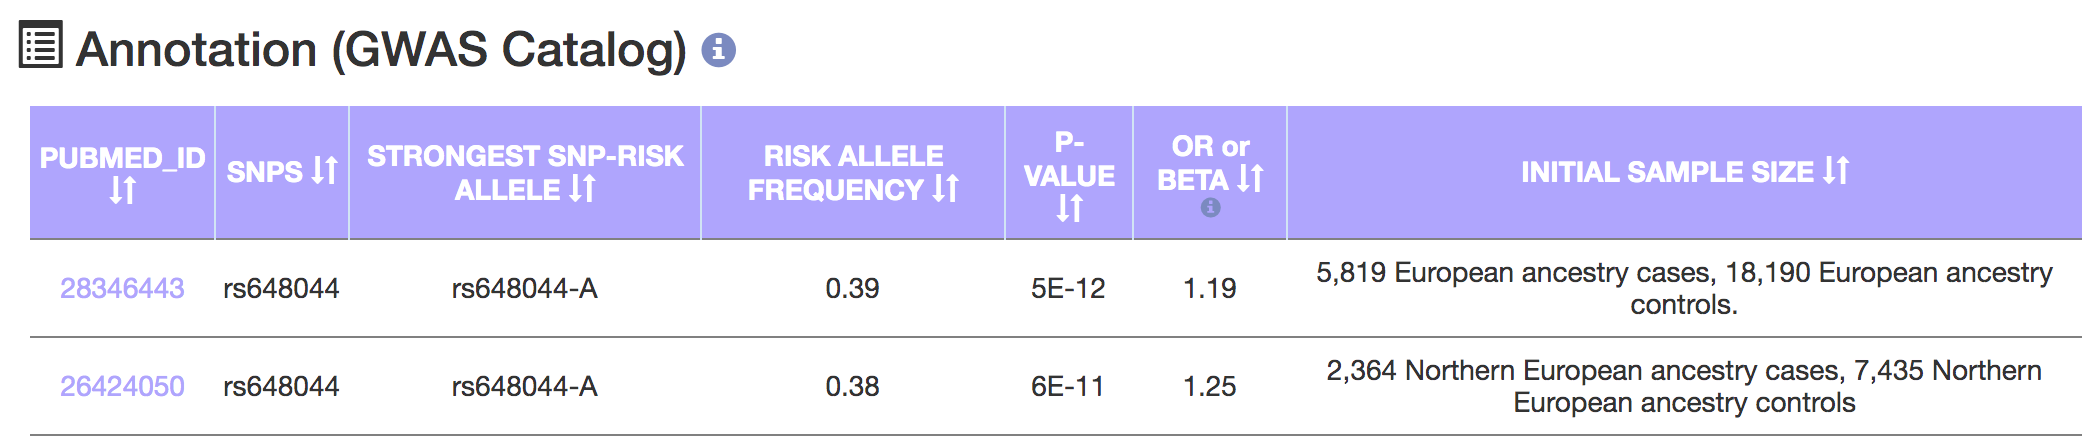
- A GWAS annotation table on the right updates based on the selected GWAS SNP.
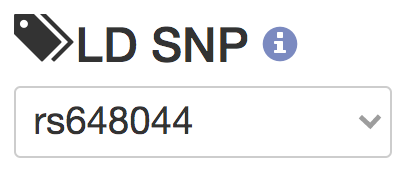
- Select or enter a high linkage disequilibrium (LD) SNP rsID and click the submit button.
- For the selected GWAS SNP, select one of the SNPs in high LD (r2 >= 0.8)
with the GWAS SNP. The LD calculations are based on the 1000 Genomes Phase 3 (EUR) data.
- By clicking the submit button, the various modules organized as tabs below show the detailed analyis results of the selected GWAS and high LD SNPs.
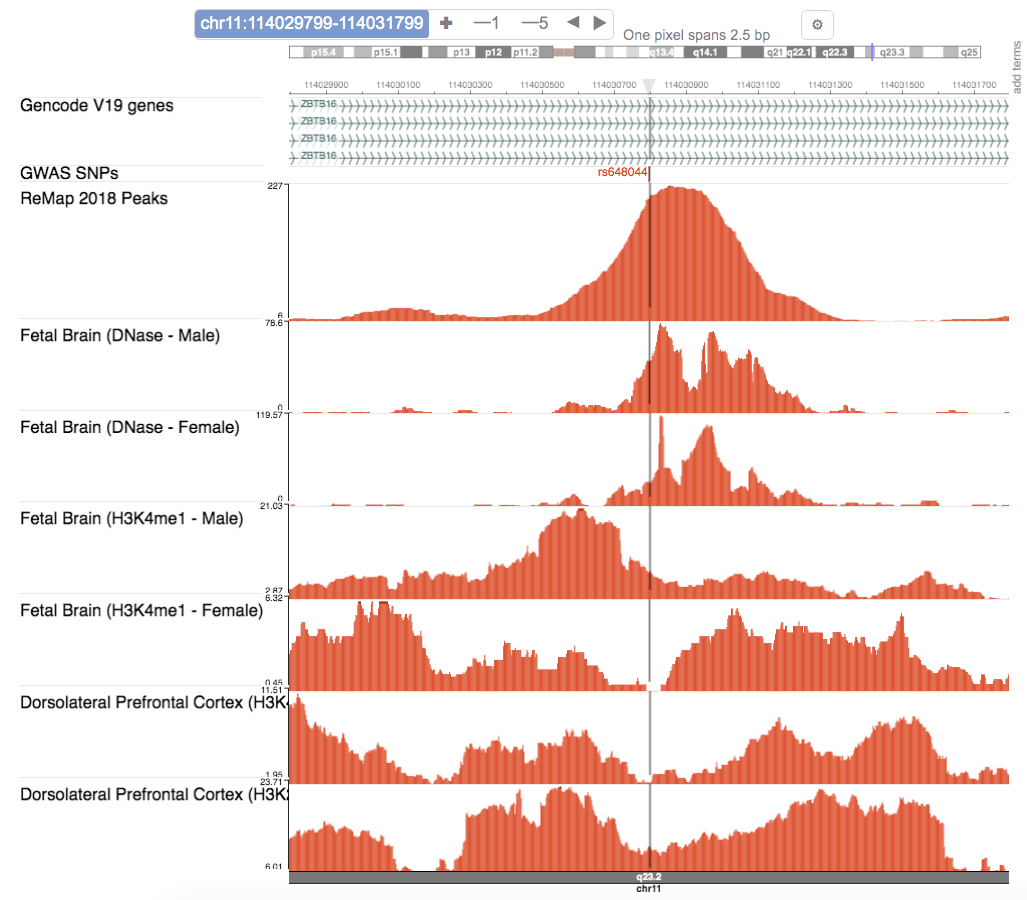
- Genome browser
- For the selected LD SNP, the genome browser shows various tracks at the SNP's locus.
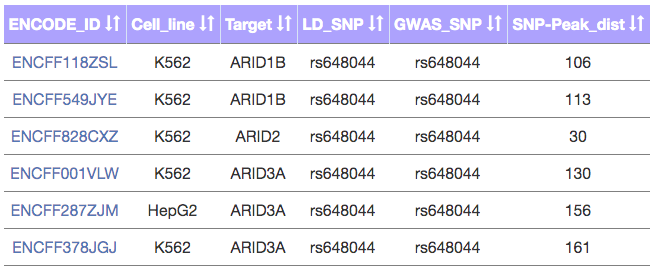
- ENCODE data
- For the selected LD SNP, this tab shows all the ChIP-seq datasets from ENCODE which contain peaks overlapping the LD SNP.
- The table can be filtered based on brain tissue/cell lines.
- Motif disruption
- For the selected LD SNP, motif analysis as described in the paper is performed to show all the potential transcription factors whose binding affinity is disrupted by the LD SNP.
- For each potential disruption, permutation test p-value and other information is tabulated.